Market structure — BOS and CHoCH explained
Market structure is the cheapest analysis on the chart. You need no indicator, no subscription — just the highs and the lows, in order, and one setting for what counts as a swing. It is also, on this site, the third and least clear of three separate reads: the RSI wave (lesson 19) is read first and is the main, fast read; the moving-average bundle on price (lesson 18) is read second and only confirms; structure is read last, and its labels are late by nature. That cheapness is also the trap, because two traders can look at the same 1,000 candles, follow the same textbook, and mark a different number of structure points, a different trend, and therefore a different label on the same break. This lesson does three things nobody teaching BOS and CHoCH usually bothers with: it shows exactly where the disagreement comes from and how large it is, it prices the textbook entry against the site’s running scoreboard, and it works out the one four-second test that tells you whether a change of character is worth trading at all before you take it.
KEY TAKEAWAYS
- BOS and CHoCH are one event with two names. A close below the last swing low is a BOS in a downtrend and a CHoCH in an uptrend. The label carries your prior belief, not new information about the candle.
- Your swing setting, not the market, sets how much structure exists. On 1,000 candles the expected count of swing highs is 1,000 ÷ (2n+1) — 200 points at a 2-bar setting, 91 at a 5-bar one. The stricter trader simply cannot see 54.5% of the looser trader’s structure. Simulated random walks give fewer points of both kinds (about 26 and 11 per 200 candles) but the same one-sided gap.
- Structure is always stale by the setting. A swing point at setting n cannot be confirmed until n candles later. At 5 bars on a 4-hour chart, the newest structure you are allowed to draw is 20 hours old.
- The setting moves the denominator only. Loosening it multiplies how many breaks fire; it cannot multiply how many genuine trend changes the market makes. That arithmetic, not psychology, is why most CHoCH signals are not reversals.
- The textbook CHoCH entry pays D/h − 1. With the target D below the swing high and the protected low h below it, our worked case is 10,000 and 4,000 → 1.50R, break-even 40.0%. For 2R the protected low must sit in the top third of the way to your target.
- Confirmation costs 18.3 points. Selling the first lower high at $67,000 breaks even at 11.8%; selling the confirmed break at $63,800 breaks even at 30.1%. The confirmation has to buy more than that gap to be worth waiting for.
- The vocabulary has no word for the earliest warning. The first lower high in an uptrend is unnamed by BOS/CHoCH — and it is the moment the 18.3 points were still on the table.
- “Wait for the close” has a different price on every timeframe. If the breaking candle closes 200 through the level, the close rule costs 2.4 points of break-even win rate; if it closes 2,000 through, it costs 24.1.
What are BOS and CHoCH in plain language?
Two words for two moments in the same story: one says the trend just did what a trend is supposed to do, the other says it just failed to.
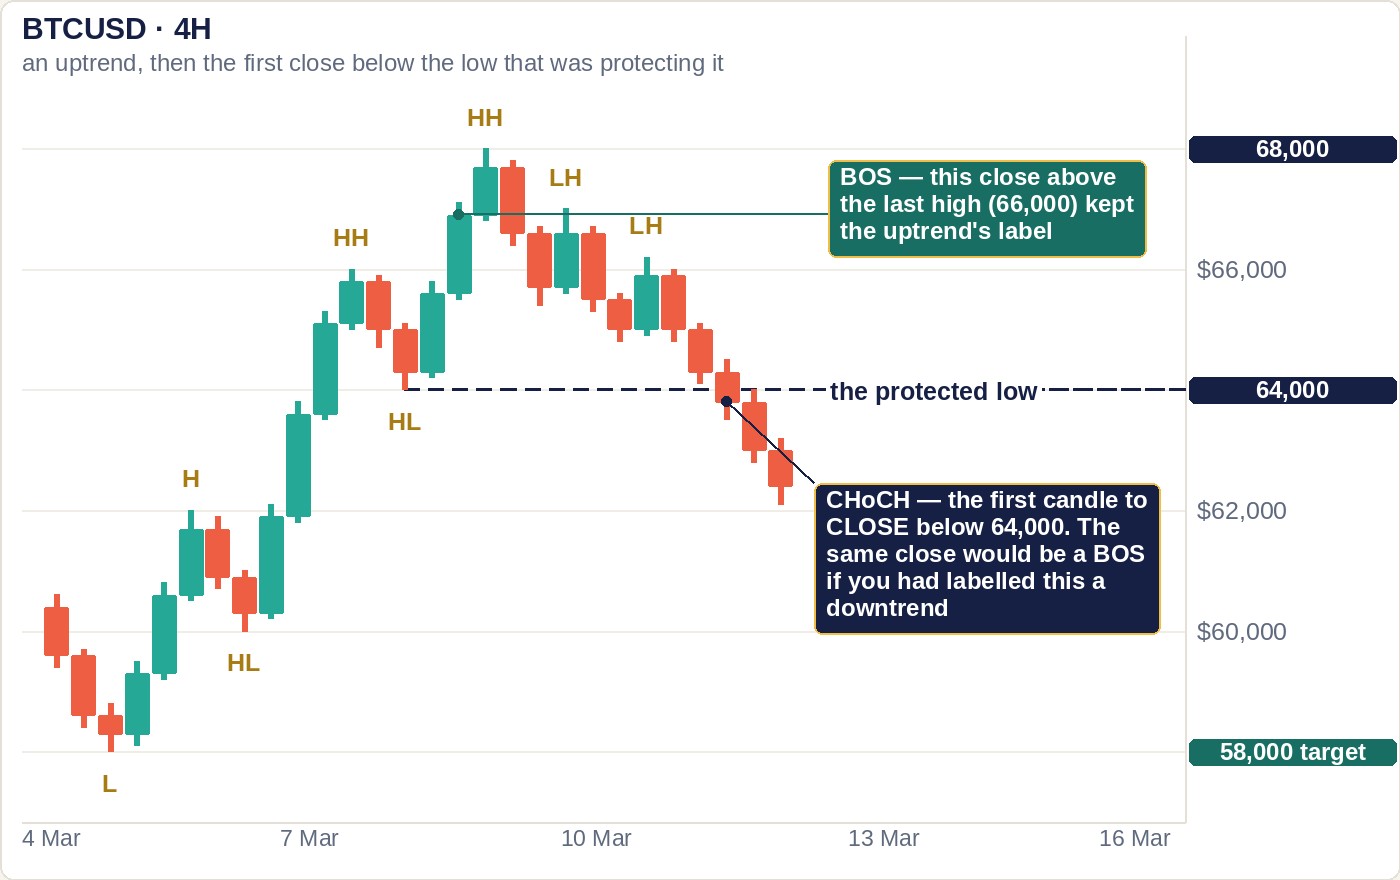
Start with the structure itself, because both labels are defined on top of it. An uptrend, in this vocabulary, is a sequence of higher highs (HH) and higher lows (HL) — each peak above the last peak, each trough above the last trough. A downtrend is lower highs (LH) and lower lows (LL). That is the whole definition, and it is deliberately mechanical: you are not asked to judge whether the market feels strong, only whether the last two peaks and the last two troughs are in ascending or descending order.
Now the two labels:
- Break of structure (BOS). Price closes beyond the last swing point in the direction the trend was already going. In an uptrend, that is a close above the last swing high. It is the event that keeps the sequence going: for an uptrend to continue, it has to keep making higher highs, so a BOS is simply the arrival of the next one.
- Change of character (CHoCH). Price closes beyond the swing point that was protecting the trend — in an uptrend, the last higher low. It is the first break in the wrong direction, and it says the ascending sequence has stopped being ascending.
Here is the part that gets skipped. Both are a close through a marked level. There is nothing in the candle, the volume, the wick or the body that distinguishes a BOS candle from a CHoCH candle. The only thing that decides the name is which trend you had written down before the candle arrived:
| The event on the chart | If you had labelled the trend up | If you had labelled the trend down |
|---|---|---|
| Close above the last swing high | BOS — continuation | CHoCH — first break against |
| Close below the last swing low | CHoCH — first break against | BOS — continuation |
Read that table twice, because it has a consequence most courses never state: a CHoCH cannot correct the mistake that produced it. If you mislabelled the trend, every subsequent break is mislabelled too, in exactly the same direction, with exactly the same confidence. The vocabulary is a faithful transmitter of your prior belief and adds nothing that could contradict it. That is why a change of character is properly a prompt to re-examine the trend label, not a signal to reverse the position.

Why do two traders mark different structure on the same chart?
Because “swing high” is not a fact about the market, it is a setting — and the setting decides how much structure exists.
To mark a swing you need a rule. The common one is a fractal: a candle counts as a swing high if its high is above the highs of the n candles on each side. Set n = 2 and you need it to beat two candles either side; set n = 5 and it must beat five. Both are defensible. They are not compatible.
You can work out how much they differ without any market data at all. Take 1,000 candles whose highs are all different from each other and in no particular order — a deliberately neutral yardstick, not a claim about real prices. For any given candle, the chance it is the highest of the window of 2n+1 candles centred on it is exactly 1 ÷ (2n+1). So the expected number of swing highs is:
swing points ≈ N ÷ (2n + 1)
| Swing setting n | Swing highs per 1,000 candles | Confirmation lag | Lag on a 4-hour chart |
|---|---|---|---|
| 1 | 333 | 1 candle | 4 hours |
| 2 | 200 | 2 candles | 8 hours |
| 3 | 143 | 3 candles | 12 hours |
| 5 | 91 | 5 candles | 20 hours |
| 10 | 48 | 10 candles | 1.7 days |
Two things fall out of that table, and both are worth more than the table itself.
First, the disagreement is one-sided and it is enormous. Any candle that beats five neighbours on each side has also beaten two, so the strict trader’s points are a subset of the loose trader’s — every 5-bar swing is also a 2-bar swing, never the reverse. That makes the overlap exactly the smaller count. The 2-bar trader marks about 200 swing highs, the 5-bar trader marks about 91 of the same ones, and 109 of the loose trader’s points — 54.5% of them — simply do not exist for the strict one. More than half of one trader’s market structure is invisible to the other. Neither of them is wrong. They are running different instruments.
Second, structure is always in the past. A candle cannot be confirmed as an n-bar swing high until n more candles have closed below it. So the most recent structure point you are entitled to draw is always at least n candles old. At a 5-bar setting on the 4-hour chart, that is 20 hours of hindsight baked into every line you draw. This is not a flaw to be fixed; it is the price of the definition. But it means that “price just broke structure” always refers to a level that was fixed some time ago, and anyone showing you a swing point on the live candle is showing you a guess.
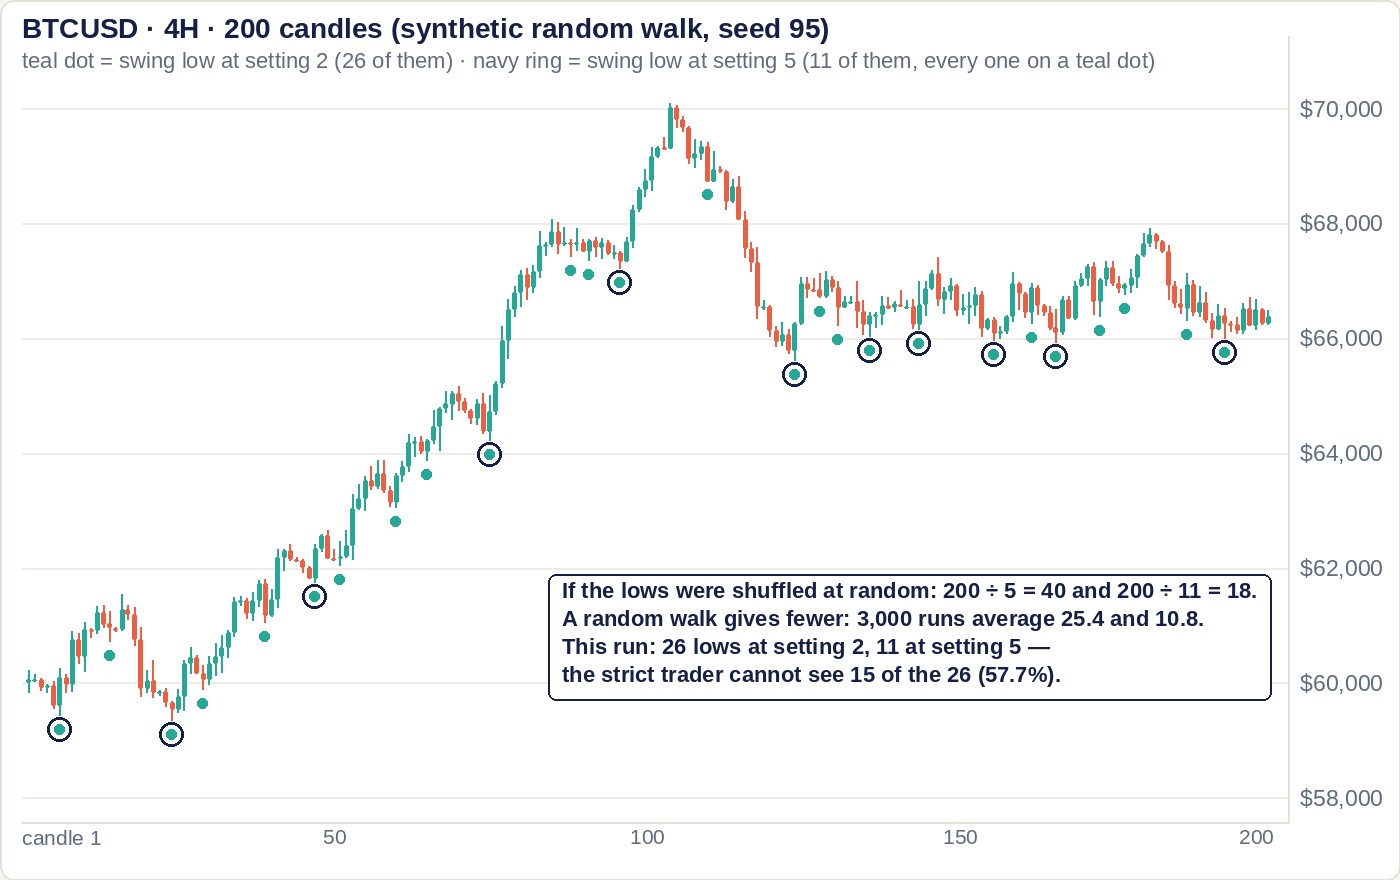
The practical rule this produces is unglamorous: pick one setting, write it down, and do not change it inside a trade. The convention this site uses is the strict one: a price-only fractal pivot of 5 bars on each side, with tiny swings ignored. Changing it mid-analysis is not refinement, it is re-drawing the evidence after seeing the outcome — and because the loose set contains the strict set, you can always find a smaller swing that says what you want. That is the mechanism by which structure analysis quietly becomes unfalsifiable.
How many of these breaks can possibly be trend changes?
Far fewer than fire — and the reason is arithmetic, not skill. You control how many signals appear. You do not control how many reversals happen.
Put the two numbers side by side. Over 1,000 four-hour candles — about 167 days — a 2-bar setting offers roughly 200 swing highs and 200 swing lows: 400 levels whose breach could be labelled. How many times does a market genuinely change direction in five and a half months, in the sense that matters to a swing trader holding for days? A single-digit number. The slide course this site learned from teaches that a ranging, directionless state is the market’s main condition rather than the exception, which points the same way.
So the ratio is set before you look at a single chart. And here is the uncomfortable part: your swing setting moves the denominator and leaves the numerator alone. Loosening from 5 bars to 2 bars multiplies your candidate levels by 2.2×. It does not create a single extra trend change. Tightening from 2 bars to 5 bars removes 54.5% of the signals and removes none of the reversals — every genuine multi-week turn will still break a 5-bar swing on its way, because a 5-bar swing is also a 2-bar swing.
That asymmetry is the whole practical argument for a stricter setting, and it is a much better argument than “it filters noise”, because it is checkable. It also has a cost, printed in the table above: 20 hours of extra lag on the 4-hour chart. You are buying a smaller denominator with lateness, and the next two sections are about exactly what that lateness is worth in money.
The conclusion to carry forward is not that CHoCH is useless. It is that a change of character can never be a standalone entry trigger, because the base rate of “this break is the reversal” is structurally low and no amount of chart-reading changes the counting. It has to be paired with an invalidation level and a size rule, which is what the rest of this lesson builds.
What does the textbook change-of-character trade actually pay?
In our worked case, 1.50R — and there is a formula that tells you the answer before you draw anything.
Here is the setup, in round numbers chosen so every level lands on a grid line. Bitcoin on the 4-hour chart has been in an uptrend. It printed a higher low at $64,000, ran to a higher high at $68,000, then rolled over: a first lower high at $67,000, a second at $66,200, and finally a candle that closes at $63,800 — below the protected higher low. That close is the change of character. Below it, the last structural low from before the uptrend sits at $58,000, and that is the natural first target.
The textbook execution is: sell the close of the CHoCH candle, stop above the swing high that the trend failed at.
- Risk: $68,000 − $64,000 = $4,000 (using the level itself for a clean comparison)
- Reward: $64,000 − $58,000 = $6,000
- Reward-to-risk: 6,000 ÷ 4,000 = 1.50R, which breaks even at 40.0%
Now the general form. Call D the distance from the swing high down to your target, and h the depth of the protected low below that same swing high. The entry is at h below the high and the stop is at the high, so:
R:R = D ÷ h − 1
Check it: 10,000 ÷ 4,000 − 1 = 1.50. This is the same identity we derived for candlestick entries in lesson 24, and it is the same identity again because the geometry is the same — a structure whose height sets both your stop width and how late you enter. Any setup where the thing you are waiting for has a height obeys it.
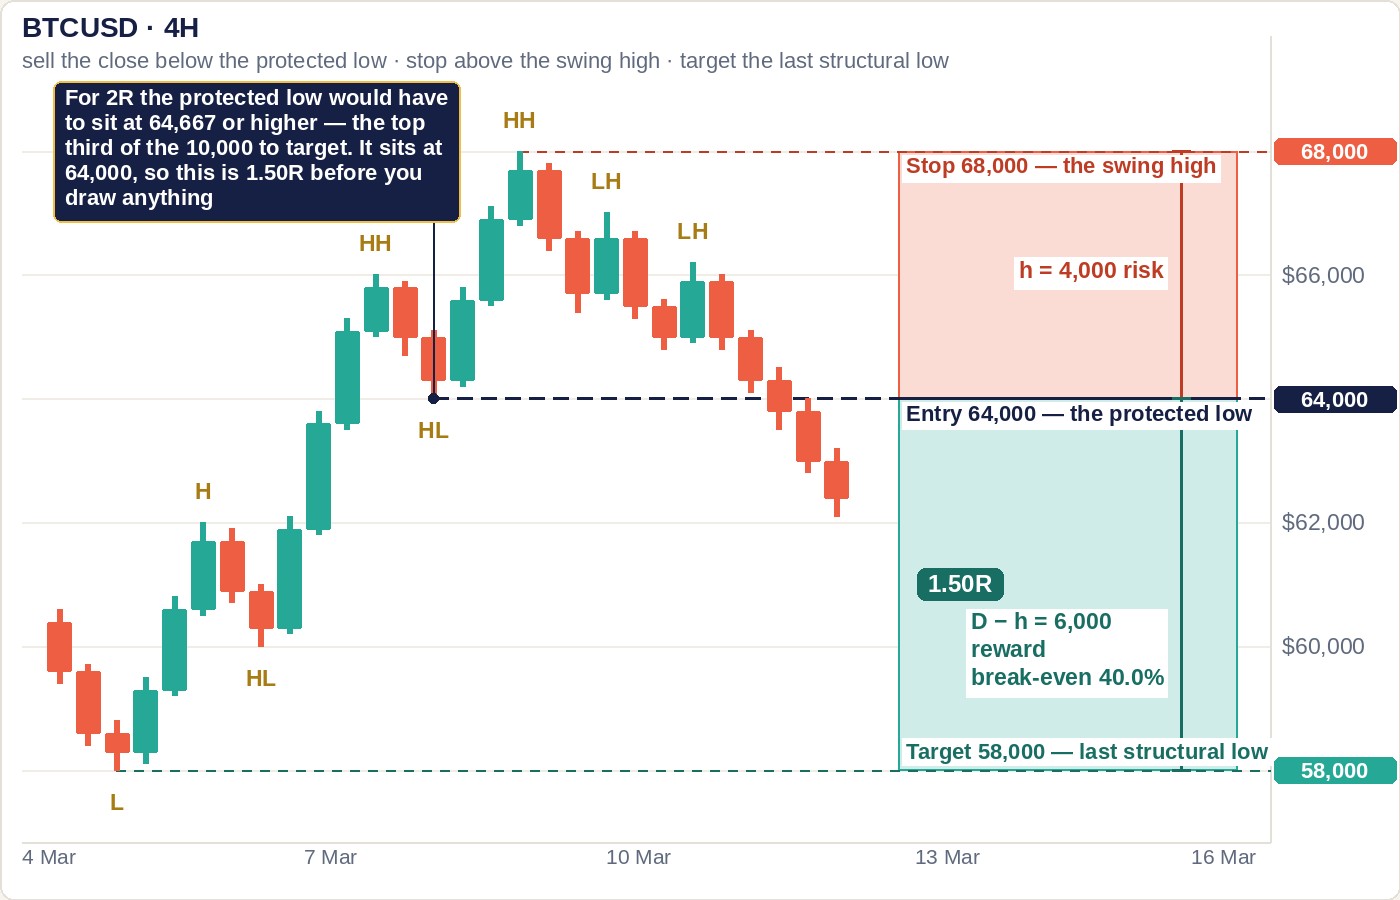
Rearranged, it becomes a test you can do in four seconds without a calculator. For the trade to pay 2.00R you need D/h − 1 ≥ 2, which is h ≤ D/3:
The protected low must sit in the top third of the way to your target.
In our case D/3 is 3,333, so the higher low would have to be no lower than $64,667 to make this an ordinary 2R trade. It is at $64,000. The setup is textbook in every visual respect — clean higher low, clean lower highs, clean break — and it is a 1.50R trade that needs to win 40% of the time. That is not a disaster. It is simply a fact you should know before you take it rather than after, and it is invisible if you only look at whether the pattern is pretty.
How much of the move is already gone when the signal fires?
Exactly as much as the identity above already told you: h ÷ D, which here is 40.0%.
From the swing high at $68,000 to the target at $58,000 is $10,000 of travel. The change of character does not confirm until price is at $64,000 — $4,000 of that $10,000 already spent. So the moment your signal arrives, 40% of the move you are trying to catch has happened without you.
The reason this is worth a section of its own is that it is the same number as the R:R ceiling, not a separate consideration. The depth of the protected low is simultaneously your stop width, your lateness, and your reward-to-risk limit. One measurement, three consequences. Which is why the top-third test does double duty: a protected low inside the top third of the move is also a signal that fires with at most a third of the move gone.
Now price the alternative honestly. The first lower high at $67,000 is a real, visible event — the moment the uptrend first failed to make a higher high. The BOS/CHoCH vocabulary has no name for it. Selling it is a counter-trend trade with no structural confirmation, and it should be treated as the lower-probability trade it is. But it is not free either way, so here is the bill:
| Moment of entry | Entry | Stop | Risk | Reward to $58,000 | R:R | Break-even win rate |
|---|---|---|---|---|---|---|
| A. First lower high — unnamed | $67,000 | $68,200 | $1,200 | $9,000 | 7.50R | 11.8% |
| B. Confirmed CHoCH, tight stop | $63,800 | $66,300 | $2,500 | $5,800 | 2.32R | 30.1% |
| C. Confirmed CHoCH, structural stop | $63,800 | $68,200 | $4,400 | $5,800 | 1.32R | 43.1% |
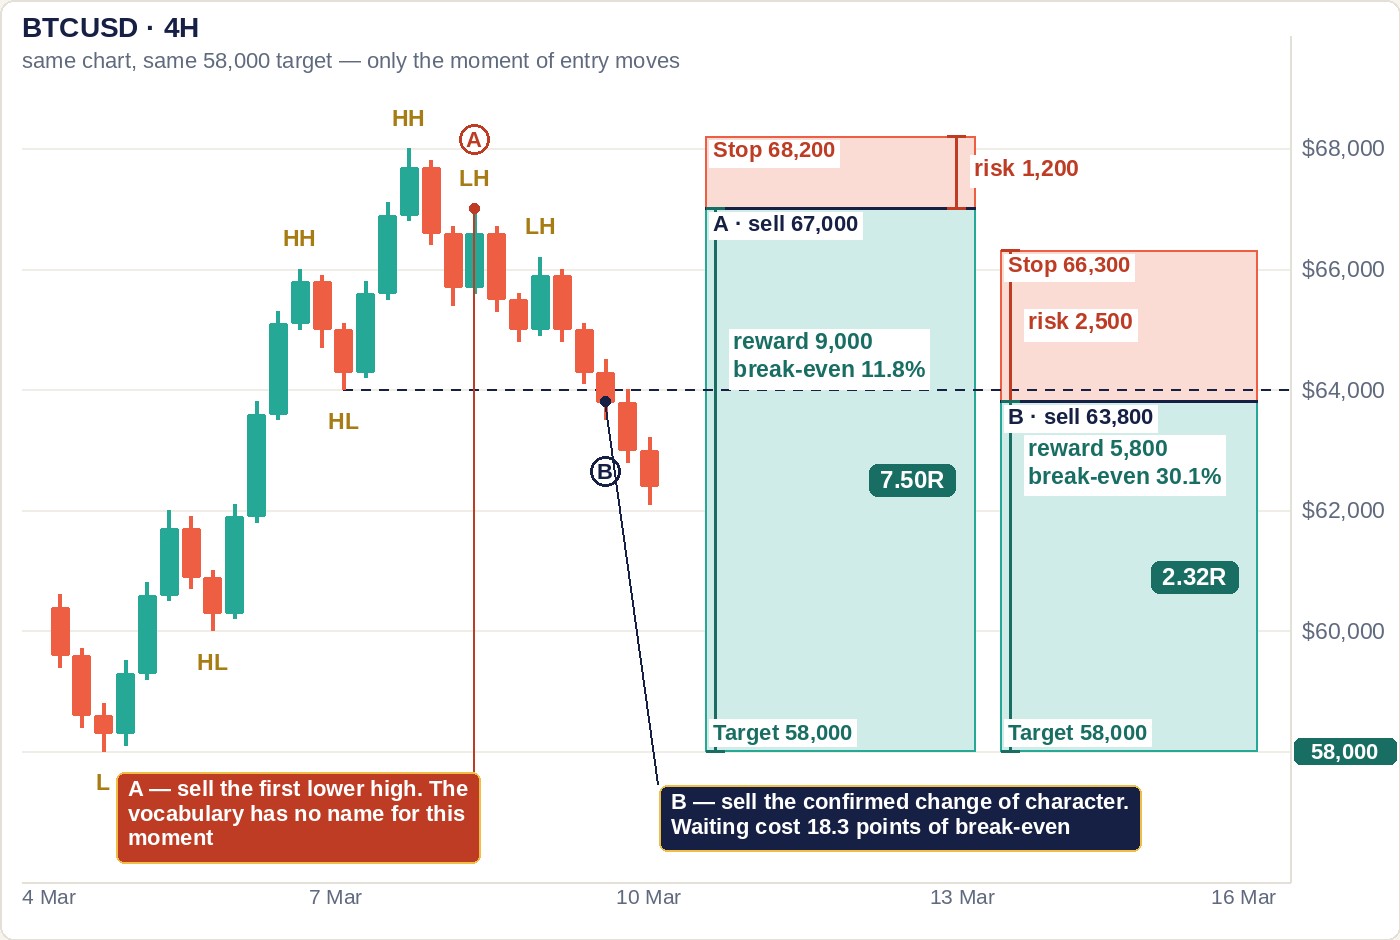
Waiting for the confirmation costs 18.3 points of break-even win rate if you then use the tight stop above the last lower high, and 31.3 points if you keep the honest structural stop above the swing high. That is the hurdle: the confirmation is worth waiting for only if being right about the trend more than 18.3 percentage points more often is what it buys you. Nobody can tell you that number for your own trading — but you can now ask the question in a form that has an answer, which is more than the usual advice to “wait for confirmation” offers.
This is the fourth entry in a scoreboard this site has been keeping across the whole course, and the pattern is consistent enough to be a lesson in itself:
| Lesson | What you waited for | Cost in break-even win rate |
|---|---|---|
| 24 | A confirming candle after the pattern | +12.3 points |
| 28 | The neckline break on a reversal pattern | +29.4 points |
| 22 | The correction to reach point 4 instead of point 3 | −28.5 points (waiting saves here) |
| 17 | The change of character to confirm | +18.3 points |
Three of those four are bills, usually between ten and thirty points of win rate, and nobody who recommends a confirmation ever prices it. The fourth is the exception that shows what separates them: waiting costs you when the thing you are waiting for is the move, and pays you when it is only a better price. Knowing which of the two a given signal is has more practical value than knowing that confirmation is generally “safer”.
Does the break need a candle close, or is a wick enough?
Both rules are defensible, and the honest way to choose between them is to notice that the close rule has a price — and that the price is different on every timeframe.
Under the wick rule, the change of character fires the instant price trades at $64,000. Under the close rule, it fires at the close of the candle that broke through, which is some distance c below the level. That distance is not a detail: it moves your entry down while your stop stays where it is, so it widens the risk and shrinks the reward at the same time. Using the tight stop at $66,300 and the target at $58,000:
| Candle closes this far through the level | Entry | Risk | Reward | R:R | Break-even | Cost vs the wick rule |
|---|---|---|---|---|---|---|
| $0 — wick rule, fires at the level | $64,000 | $2,300 | $6,000 | 2.61R | 27.7% | — |
| $200 | $63,800 | $2,500 | $5,800 | 2.32R | 30.1% | +2.4 pts |
| $500 | $63,500 | $2,800 | $5,500 | 1.96R | 33.7% | +6.0 pts |
| $1,000 | $63,000 | $3,300 | $5,000 | 1.52R | 39.8% | +12.0 pts |
| $2,000 | $62,000 | $4,300 | $4,000 | 0.93R | 51.8% | +24.1 pts |
Read the last column as a price list. On a small timeframe where the breaking candle closes a couple of hundred through the level, requiring a close costs about 2.4 points of break-even win rate — cheap, and almost certainly worth it, because it removes every break that was only a wick. On a daily chart of the same move, where a single candle can close $2,000 through a level, the identical rule costs 24.1 points and has turned a 2.61R trade into a sub-1R one. Same rule, ten times the price.
So “always wait for the close” is not a universal law; it is a rule whose cost scales with candle size relative to your stop. The version that survives on every timeframe is: require the close, and require the stop to be wide enough that a normal candle’s close cannot consume the trade. If the number in that last column is bigger than about ten points on your chart, you are not confirming a break — you are chasing one.
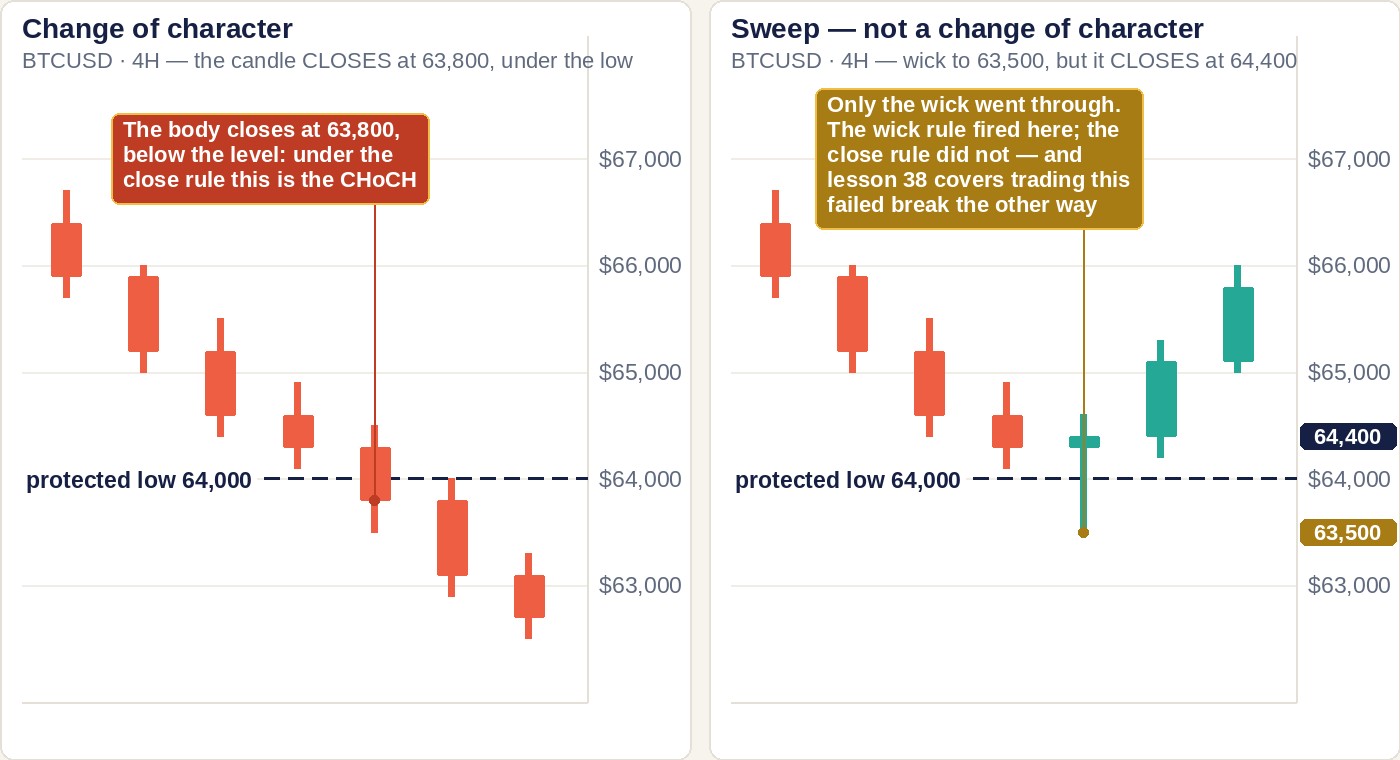
A wick that pushes through the level and closes back inside it is not a change of character at all — it is the failed break, and it is a setup in its own right. Lesson 38 prices it: on 400,000 simulated bars, 75.7% of breaks above a 50-bar high closed back inside within five bars, and fading one is worth the range height divided by how far price got past the level.
What does market structure not tell you?
Who did it, and why. Those are the two things the labels are most often used to imply, and candles cannot supply either.
It is worth being exact here, because this vocabulary travels with a lot of narrative attached. What is genuinely observable in a chart of open, high, low and close is: where the swings are under a stated setting, whether a level was breached, and whether the breach happened on a wick or a close. All of that is measurable and reproducible — give two people the same data and the same setting and they will get the same answer.
What is interpretation is everything else: that a break reveals institutional intent, that a particular participant caused it, that the move was engineered. Public candle data does not identify who traded. A break of a higher low looks identical whether it was caused by a fund rotating out, a leveraged long being force-closed in a liquidation cascade, or simply nobody bidding for an hour. Any story that names an actor is a hypothesis about the mechanism, and it should carry the same weight as any other untested hypothesis — which is to say, it should not change your position size.
Structure also says nothing about timeframe authority. A change of character on the 15-minute chart inside an intact daily uptrend is not a reversal of anything except the 15-minute sequence, and treating it as a reversal is precisely the frame-mixing error that lesson 21 measured at a 79.6% loss of reward. Before a break means anything, you have to have decided which frame supplies direction and which supplies execution — and, on this site, checked the RSI wave and the MA bundle first, because a structure break on its own is the last and least clear of the three reads. The slide course this site learned from puts it plainly: the higher the timeframe a HH/HL structure forms on, the more durable it is.
A break of structure on one frame is also, quite often, the first frame of a disagreement rather than a change in the market. Because a weekly candle is built out of daily ones, the fast frame always breaks first and the slow frame cannot follow for several of its own candles. Bull, bear and sideways works out the floor on that delay and why it makes a clean flip from one phase to the other impossible by construction.
When is this advice wrong?
Three places, and all three are worth knowing because they are where the arithmetic stops applying rather than where it is disputed.
The swing-count formula assumes shuffled highs — and prices are not shuffled. N ÷ (2n+1) is exact when each candle’s high is an independent draw. A price series is a random walk: each high is roughly the previous one plus a step, so neighbouring candles are correlated and local extremes are rarer. We measured the gap rather than guessing at it: 3,000 runs of 200 four-hour candles with Gaussian steps (standard deviation $330 per candle, wick $140, no drift, seeds 0–2,999) average 25.6 swing lows at setting 2 and 11.0 at setting 5, against the formula’s 40 and 18 — about 36% and 39% fewer. Adding a mild upward drift of $28 per candle barely moves it (25.4 and 10.8). So the formula overstates how much structure exists on every chart, before any trend is involved, and a trending stretch pushes the count lower still. Treat the table as a yardstick for the direction and rough size of the effect, not as a prediction of what your chart will show. What survives regardless is the part that does not depend on the model at all: the strict set is a subset of the loose set, so the disagreement between two settings is always one-sided and always the difference between the two counts, whatever those counts turn out to be — in the simulation the strict trader was blind to 57.5% of the loose trader’s lows, not 54.5%, and the direction never changed.
The identity assumes one specific execution. R:R = D/h − 1 holds when you enter at the protected low and stop at the swing high. Enter on a retracement back up after the break, or stop above the last lower high instead, and the geometry changes — which is exactly what rows B and C in the entry table show. The formula is a fast way to price the textbook version, not a claim that the textbook version is the version you should trade.
Costs are not in any of these numbers. Every R figure on this page is before fees, funding and slippage. A break of an obvious level is one of the least liquid moments on the chart, because the resting orders that were sitting there have just been consumed — so the CHoCH entry is precisely where a market order is likely to fill worse than the price you were looking at. On the tight-stop row, $2,500 of risk absorbs a $50 slip as 2% of the trade; on a smaller account trading a tighter version of the same idea, it can be a much larger fraction. Price it in before you decide the confirmation was cheap.
And the standing caveat behind all of it: none of this says a change of character predicts anything. It says that if you are going to trade one, the arithmetic of what it pays and how late it arrives is knowable in advance, and there is no reason to discover it afterwards.
Common mistakes
| Mistake | What it costs | Do this instead |
|---|---|---|
| Treating a CHoCH as a signal to reverse the position | You inherit the trend label you already had, mistake included — the label cannot contradict it | Treat it as a prompt to re-examine the higher-frame label first |
| Changing the swing setting mid-analysis | The loose set contains the strict set, so you can always find a swing that says what you want | Write the setting down before the trade and leave it alone |
| Marking a swing point on the live candle | A swing at setting n is not confirmed for n more candles — 20 hours at 5 bars on 4H | Only draw structure that has finished forming; the newest line is always stale |
| Taking the textbook entry without measuring h and D | Our clean-looking case pays 1.50R and needs 40.0% — not the 2R most people assume | Four-second test: is the protected low in the top third of the way to target? |
| Waiting for confirmation without pricing it | +18.3 points of break-even win rate on the tight stop, +31.3 on the structural one | Decide whether the confirmation buys back more than that before you wait for it |
| Applying “wait for the close” identically on every timeframe | 2.4 points on a small candle, 24.1 on a large one — same rule, ten times the price | Check the close distance against your stop width; over ~10 points, widen or skip |
| Reading a lower-frame CHoCH as a reversal of the higher frame | The frame-mixing error priced at a 79.6% loss of reward in lesson 21 | Fix which frame gives direction and which gives execution, then label breaks inside that |
Frequently asked questions
What is the difference between BOS and CHoCH?
Direction relative to the trend you had already labelled — and nothing else about the candle. A break of structure is a close beyond the last swing point in the same direction the trend was going; a change of character is a close beyond the swing point protecting that trend, so it is the first break against it. The same close below the same swing low is a BOS in a downtrend and a CHoCH in an uptrend. That is why the label carries no independent information: it is a function of your prior belief, and if that belief was wrong the label is wrong in the same direction with the same confidence. Use a CHoCH as a reason to re-check the trend label, never as a reason to assume it has flipped.
Does a change of character mean the trend has reversed?
Usually not, and the reason is counting rather than psychology. On 1,000 four-hour candles a 2-bar swing setting offers roughly 400 levels whose breach could be labelled, while the number of genuine multi-week direction changes over the same five and a half months is a single-digit figure. Your setting controls how many candidates appear; it cannot control how many reversals occur. Loosening from 5 bars to 2 bars multiplies the candidates by 2.2 times and creates no extra reversals at all. So a CHoCH is best understood as an event with a structurally low base rate — which is exactly why it needs an invalidation level and a size rule attached, rather than being traded as a standalone trigger.
Should a break of structure require a candle close, or is a wick enough?
Require the close, but check what it costs you first, because the price is different on every timeframe. Requiring a close moves your entry down by however far the candle closed through the level, which widens the risk and shrinks the reward at once. In our worked case with a $2,300 base risk, a candle closing $200 through costs 2.4 points of break-even win rate, one closing $1,000 through costs 12.0 points, and one closing $2,000 through costs 24.1 points and turns a 2.61R trade into 0.93R. The workable version of the rule is therefore: require the close, and require the stop to be wide enough relative to a normal candle that the close cannot eat the trade. If the cost is running above roughly ten points on your chart, the timeframe or the stop is wrong, not the rule.
What swing setting should I use to mark market structure?
On this site, 5 bars on each side with tiny swings ignored — and whichever setting you choose, keep it. The real argument for a stricter setting is not that it filters noise but that it only shrinks the denominator: going from 2 bars to 5 bars removes 54.5% of your swing points and removes none of the genuine reversals, because every 5-bar swing is also a 2-bar swing and any real turn breaks both. The cost is lateness — a 5-bar swing is not confirmed for five more candles, which is 20 hours on a 4-hour chart. So pick the setting whose lag you can live with given how long you hold trades, write it down, and do not change it inside a trade. Changing it after seeing price is how structure analysis becomes unfalsifiable.
How do I know if a change of character is worth trading before I take it?
Measure two distances and do one division. Let h be the depth of the protected swing low below the swing high the trend failed at, and D the distance from that same swing high down to your target. The textbook entry — sell the break, stop above the swing high — pays D/h − 1, so 2.00R requires h to be no more than a third of D: the protected low has to sit in the top third of the way to your target. In our worked case h is $4,000 against a D of $10,000, which is 1.50R and a 40.0% break-even — a perfectly ordinary trade, but not the 2R the chart’s tidiness suggests. The same ratio also tells you how late the signal is: h/D is the fraction of the move already gone when it fires, 40.0% here.
Keep the whole course next to your charts
The whole slide course — ten free PDF parts, 351 pages, taught on real charts.